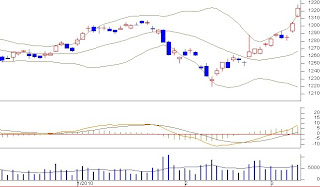
FKLI closed : 1323.5, changed : +20.5 points, volume : higher.
Bollinger band reading : bullish but over extended.
MACD Histrogram : going higher. buyer dominated.
Support : 1315, 1307, 1300 level.
Resistant : 1325, 1335, 1345 level.
Comment :
FKLI hit another new high today followed by partial profit taking pushed FKLI to closed slightly off the high with accelerating volume. All indicators on screen suggesting a bullish outlook. Having said that, today up candle bar closed a little far away from the upper Bollinger band shows that the upward surge has been over extended with possible pullback effect taking place in the near term before the resume upward.
When to buy : buy at support or weakness with quick cut loss and profit target.
When to sell : sell at resistant or strength with quick cut loss and profit target.

No comments:
Post a Comment